You're planning voter contact strategy. Someone on the team says "higher turnout helps us"—or "lower turnout helps us"—based on conventional wisdom. Before you allocate resources based on that assumption, you need to know if it's actually true in your jurisdiction.
The answer lives in the Voter Metrics section of the jurisdiction page: registration share versus electorate share at different turnout levels. Here's what that analysis looks like in practice, using Calexico, California.
How this analysis is done
Open any jurisdiction page in The Ballot Book and scroll to the Voter Metrics section, which compares registration share to actual electorate share at different turnout levels. Comparing a midterm to a presidential election reveals whether higher turnout helps or hurts each party in that specific jurisdiction. Calexico is used as an example; the same method applies anywhere with sufficient voter data.
The Situation
You're advising a Democratic campaign in a heavily Latino border city. The 2024 general election is coming, and turnout will be significantly higher than the 2022 midterm. The conventional wisdom is clear: higher turnout brings more casual voters, who skew younger and more Democratic. Your advantage should grow.
Except it didn't.
The Shortcut That Falls Short
The standard playbook says lower turnout elections produce more conservative electorates. The logic is intuitive: older, wealthier voters show up consistently, while younger, lower-income voters are more sporadic. Midterms favor Republicans; presidential years favor Democrats.
This is true often enough that people stop checking. But "often enough" isn't "always," and in a close race, the difference matters.
What the Numbers Said
Calexico's voter metrics across two election cycles told a story that contradicted the playbook:
2022 General Election (Midterm)
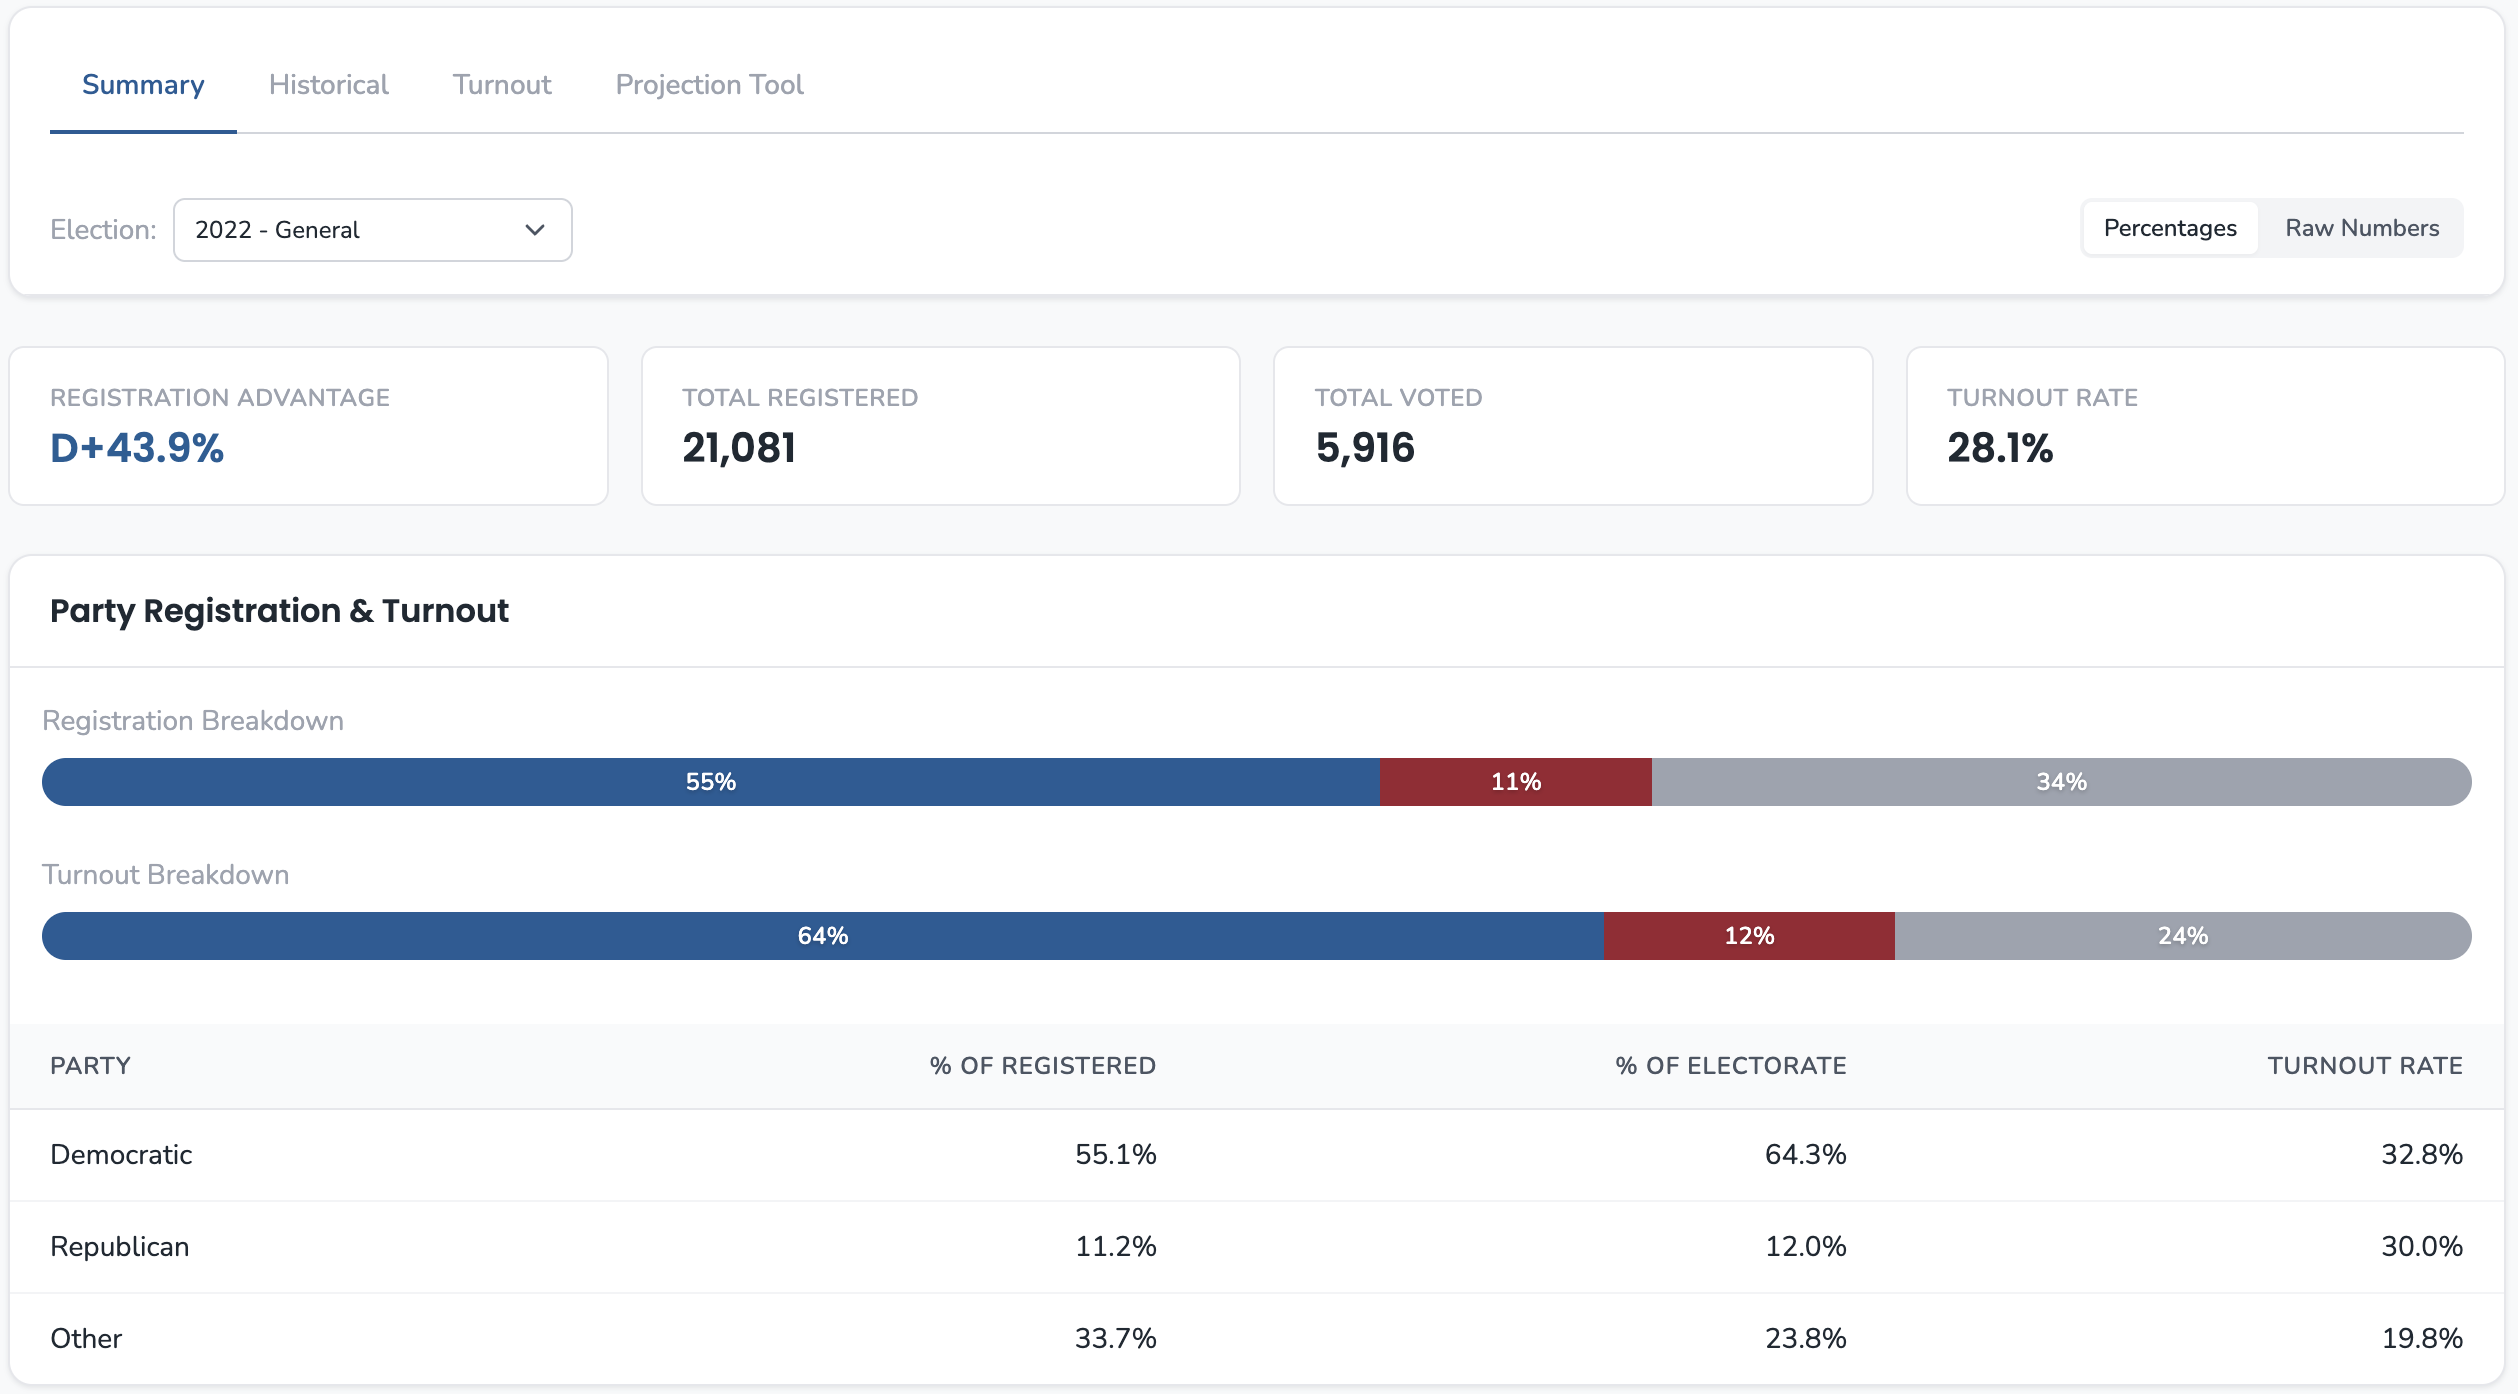
- Turnout: 28.1%
- Democrats: 64.3% of electorate
- Republicans: 12.0% of electorate
2024 General Election (Presidential)
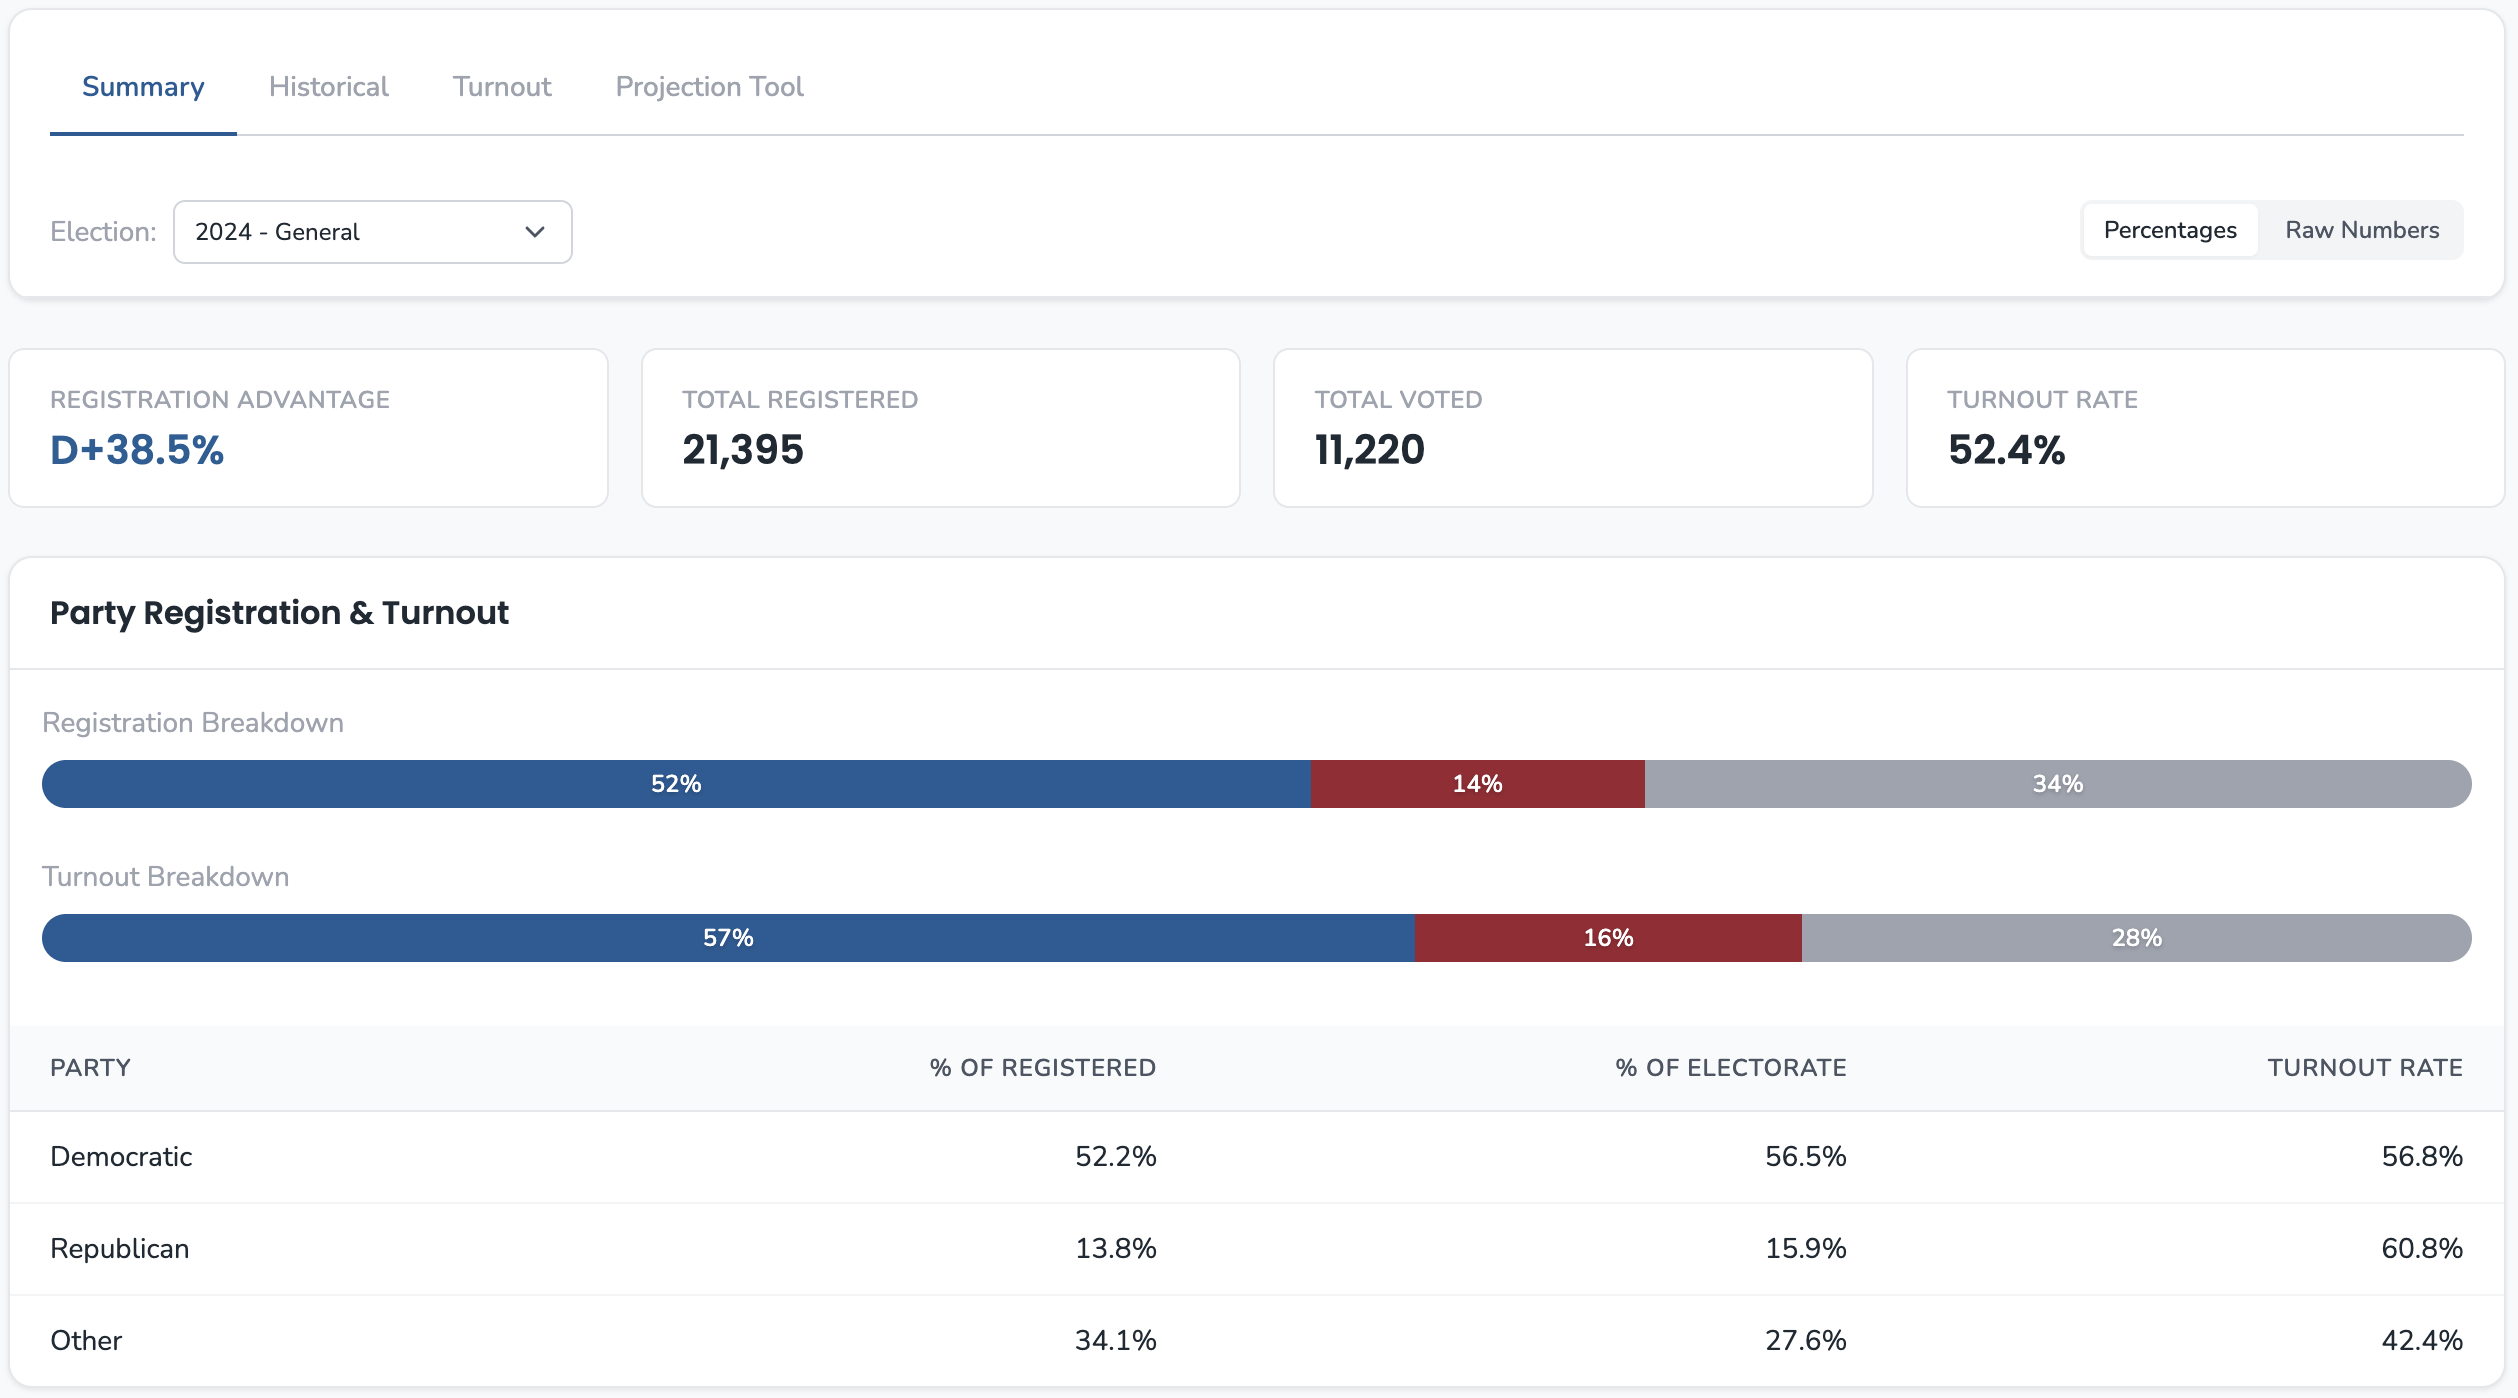
- Turnout: 52.4%
- Democrats: 56.5% of electorate
- Republicans: 15.9% of electorate
Higher turnout. Lower Democratic share. The exact opposite of what conventional wisdom predicted.
What Made It Counterintuitive
The 2024 election nearly doubled turnout—from 28% to 52%. An additional 5,000+ voters showed up. And when they did, the Democratic share of the electorate dropped by 7.8 points.
In a D+38 registration city, the new voters weren't Democratic reinforcements. They were the voters who usually stay home—and in Calexico, those voters leaned more Republican than the consistent Democratic base.
What Explains It
The Voter Metrics breakdown shows why. In 2022, at 28% turnout, the people who showed up were disproportionately the most engaged Democratic voters. The consistent base. Republicans were 11.2% of registration but only 12.0% of the electorate—slightly overperforming their registration share even then.
In 2024, at 52% turnout, Republicans expanded that overperformance. They went from 12.0% to 15.9% of the electorate—a 3.9-point gain. Meanwhile, Democrats went from 64.3% to 56.5%—a 7.8-point drop. The surge voters weren't breaking Democratic; they were diluting Democratic strength.
What It Actually Meant
If a campaign had assumed the conventional wisdom—"presidential year turnout helps Democrats"—they would have misallocated resources. The strategic picture was exactly backwards:
- In 2022, with low turnout, Democrats held a 52.3-point electorate advantage (64.3 - 12.0)
- In 2024, with high turnout, that advantage dropped to 40.6 points (56.5 - 15.9)
A 12-point swing in partisan composition, driven entirely by who showed up.
What You Can Actually Say
"Conventional wisdom says higher turnout helps Democrats, but Calexico is the opposite case. In the 2022 midterm, at 28% turnout, Democrats were 64% of the electorate. In the 2024 presidential, at 52% turnout, they dropped to 57%.
The surge voters weren't Democratic reinforcements—they were less-engaged voters who diluted Democratic strength. Higher turnout actually narrowed the Democratic advantage by 12 points.
If you're planning voter contact here, the goal isn't just 'turn out more people.' It's 'turn out our people faster than they turn out theirs.' And you can't know that without looking at the actual composition data."
When This Isn't the Right Approach
This analysis requires comparing elections with meaningfully different turnout levels. If you're comparing two presidential elections with similar turnout, composition shifts will be minimal.
It also requires a jurisdiction with enough voters to show patterns. In very small precincts, a handful of voters can swing percentages dramatically without revealing anything structural.
The voter metrics tell you what happened at different turnout levels. Why it happened—whether it's generational, cultural, or economic—requires additional context.