The election is over. Someone won, someone lost, and now you need to explain why. "More people voted for them" isn't going to cut it.
The question you're actually being asked is: What happened, and what does it mean? The answer lives in the Election Report—specifically in the precinct-level data that shows which voters lined up behind which candidates. Here's what that analysis looks like in practice, using the 2022 Burbank City Council race.
How this analysis is done
Open the Election Report for any past race in The Ballot Book to see precinct-level results, party alignment scores, and a heatmap showing how each candidate performed across the partisan spectrum. The precinct map view reveals geographic concentration of support. Election Reports are available for races across California where precinct data exists.
The Situation
Your client backed a city council candidate who lost. Not by much—512 votes out of nearly 73,000 cast. The debrief is scheduled. They want to know what went wrong.
Burbank is a heavily Democratic city. D+30 registration advantage. D+37 turnout advantage on election day. The candidate had decent name recognition as the incumbent, had served as mayor during COVID, answered the progressive endorsement questionnaires. On paper, everything checked out.
And yet: fourth place. Out of the money by a margin you could fit in a high school gym.
The Shortcut That Falls Short
The instinct after a close loss is to look for a single explanation. Low turnout. Bad timing. The opponent's mailer. A debate performance.
These aren't wrong, exactly—any one of them might have swung 512 votes. But they're all guesses. And if your job is to explain what happened (not just console), you need to show your work.
The other temptation is to shrug and call it a "local race"—as if city council elections don't have patterns worth understanding. That's also wrong. The partisanship score for this race was 92 out of 100. Voters sorted themselves along party lines almost as cleanly as they would in a congressional race.
What the Numbers Said
The 2022 Burbank City Council race had five candidates competing for three seats:
- Nikki Perez: 17,958 votes (24.7%) — winner
- Tamala Takahashi: 15,849 votes (21.8%) — winner
- Zizette Mullins: 14,328 votes (19.7%) — winner
- Sharon Springer: 13,816 votes (19.0%) — lost by 512 votes
- Carmenita Helligar: 10,614 votes (14.6%)
Three winners. One incumbent (Springer) who missed the cut by 512 votes. One candidate (Helligar) who never gained traction despite a similar profile to the top finishers.
The raw numbers don't explain the ordering. That's where the party alignment data comes in.
What Jumped Out
This was a nonpartisan race in a city where the electorate skews D+37 on election day. You might expect the results to feel random—five candidates with similar affiliations, voters picking based on name recognition or yard signs.
That's not what happened.
The Party Alignment box in the Race Statistics section shows:

Even in a nominally nonpartisan race, the platform identified which candidates Democratic voters gravitated toward and which ones Republican voters preferred. And here's the first surprise: the Republican-aligned candidate (Mullins) finished third and won a seat, while one of the most Democratic-aligned candidates (Helligar) finished last.
In a D+37 city.
What the Heatmap Revealed
The How Each Partisan Group Voted section breaks this down precinct by precinct.
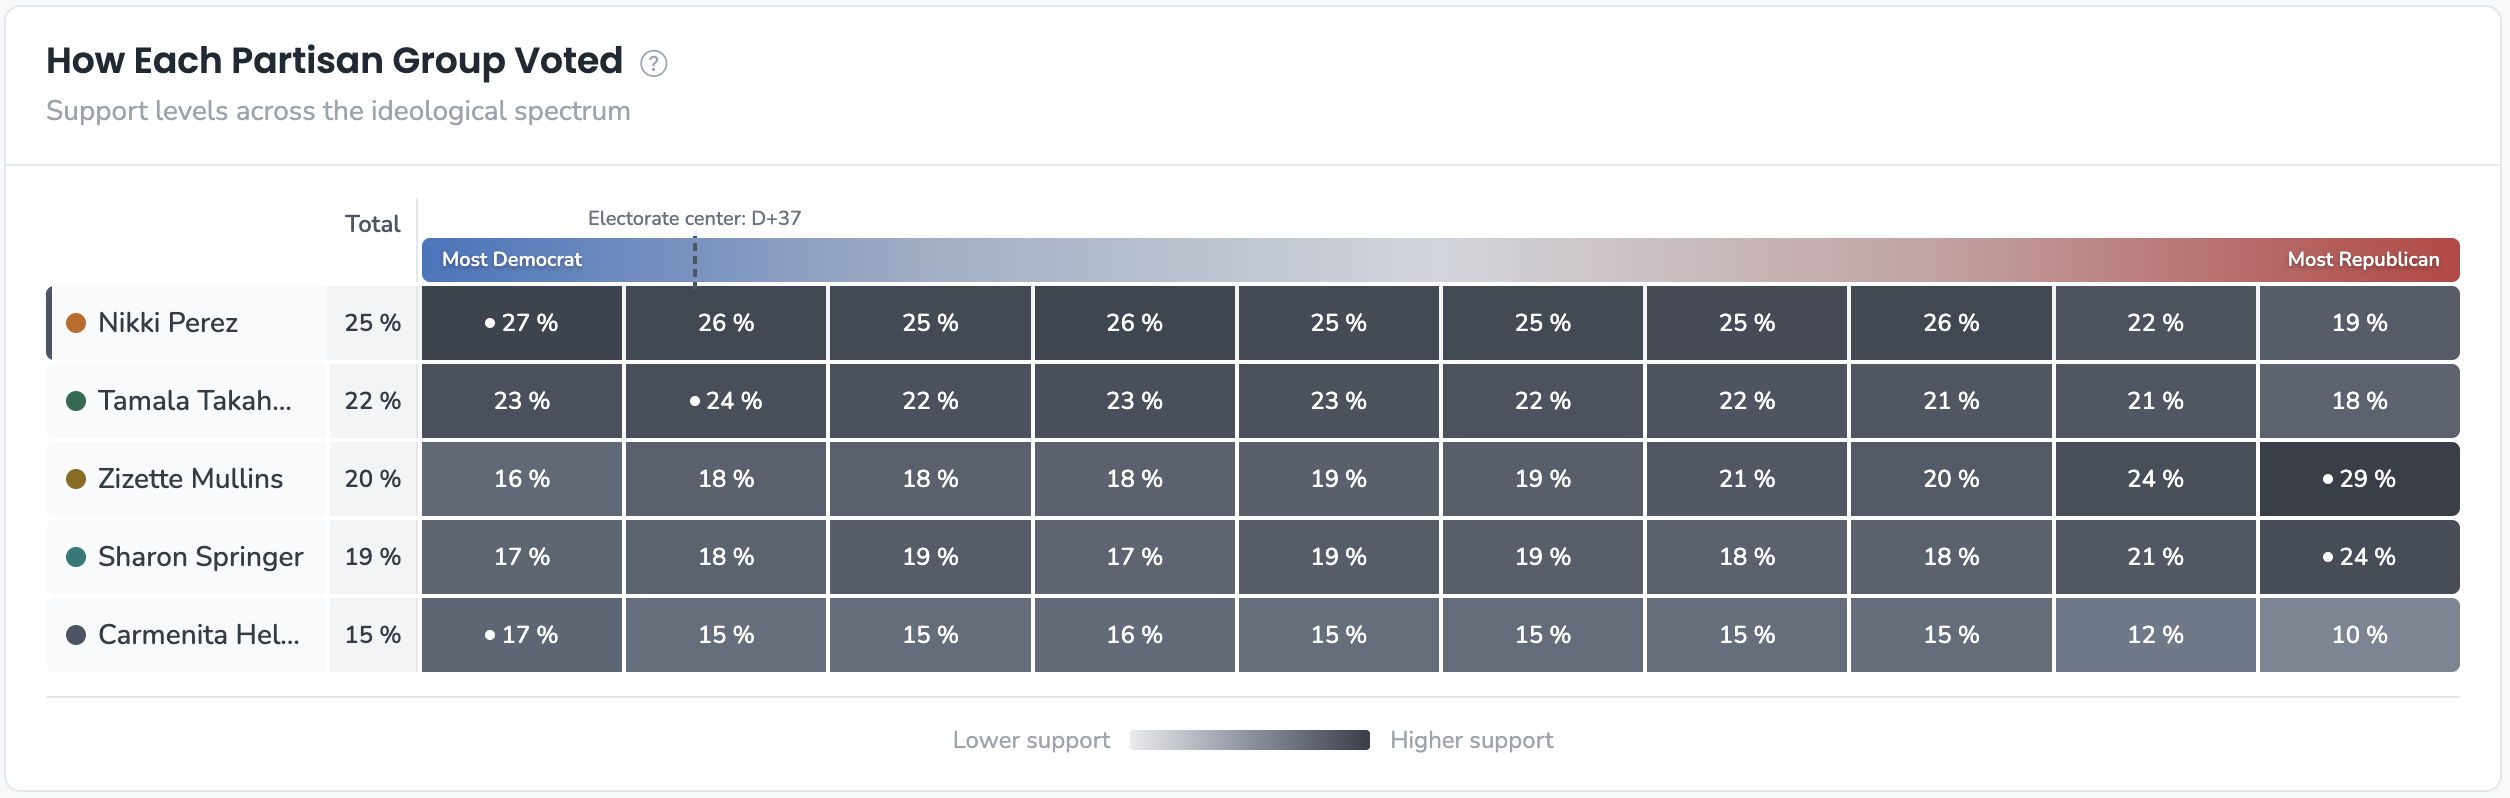
Looking at performance across the partisan spectrum:
Nikki Perez (winner, 24.7%): Remarkably flat. She pulled 27% in the most Democratic precincts and 19% in the most Republican ones. Consistent support everywhere—no concentrated base, but no holes either.
Zizette Mullins (winner, 19.7%): The opposite pattern. She pulled only 16% in the most Democratic precincts but 29% in the most Republican ones. A clear Republican lean—and she won anyway.
Sharon Springer (loser, 19.0%): Similar to Mullins—17% in Democratic areas, 24% in Republican areas. Also Republican-leaning. But her peak (24%) was five points lower than Mullins's peak (29%).
Carmenita Helligar (loser, 14.6%): Strong Democratic lean—17% in the most Democratic precincts, only 10% in Republican ones. But even her best performance couldn't match what Perez was doing across the board.
What the Map Added
The Precinct Map view made the geographic story visible.
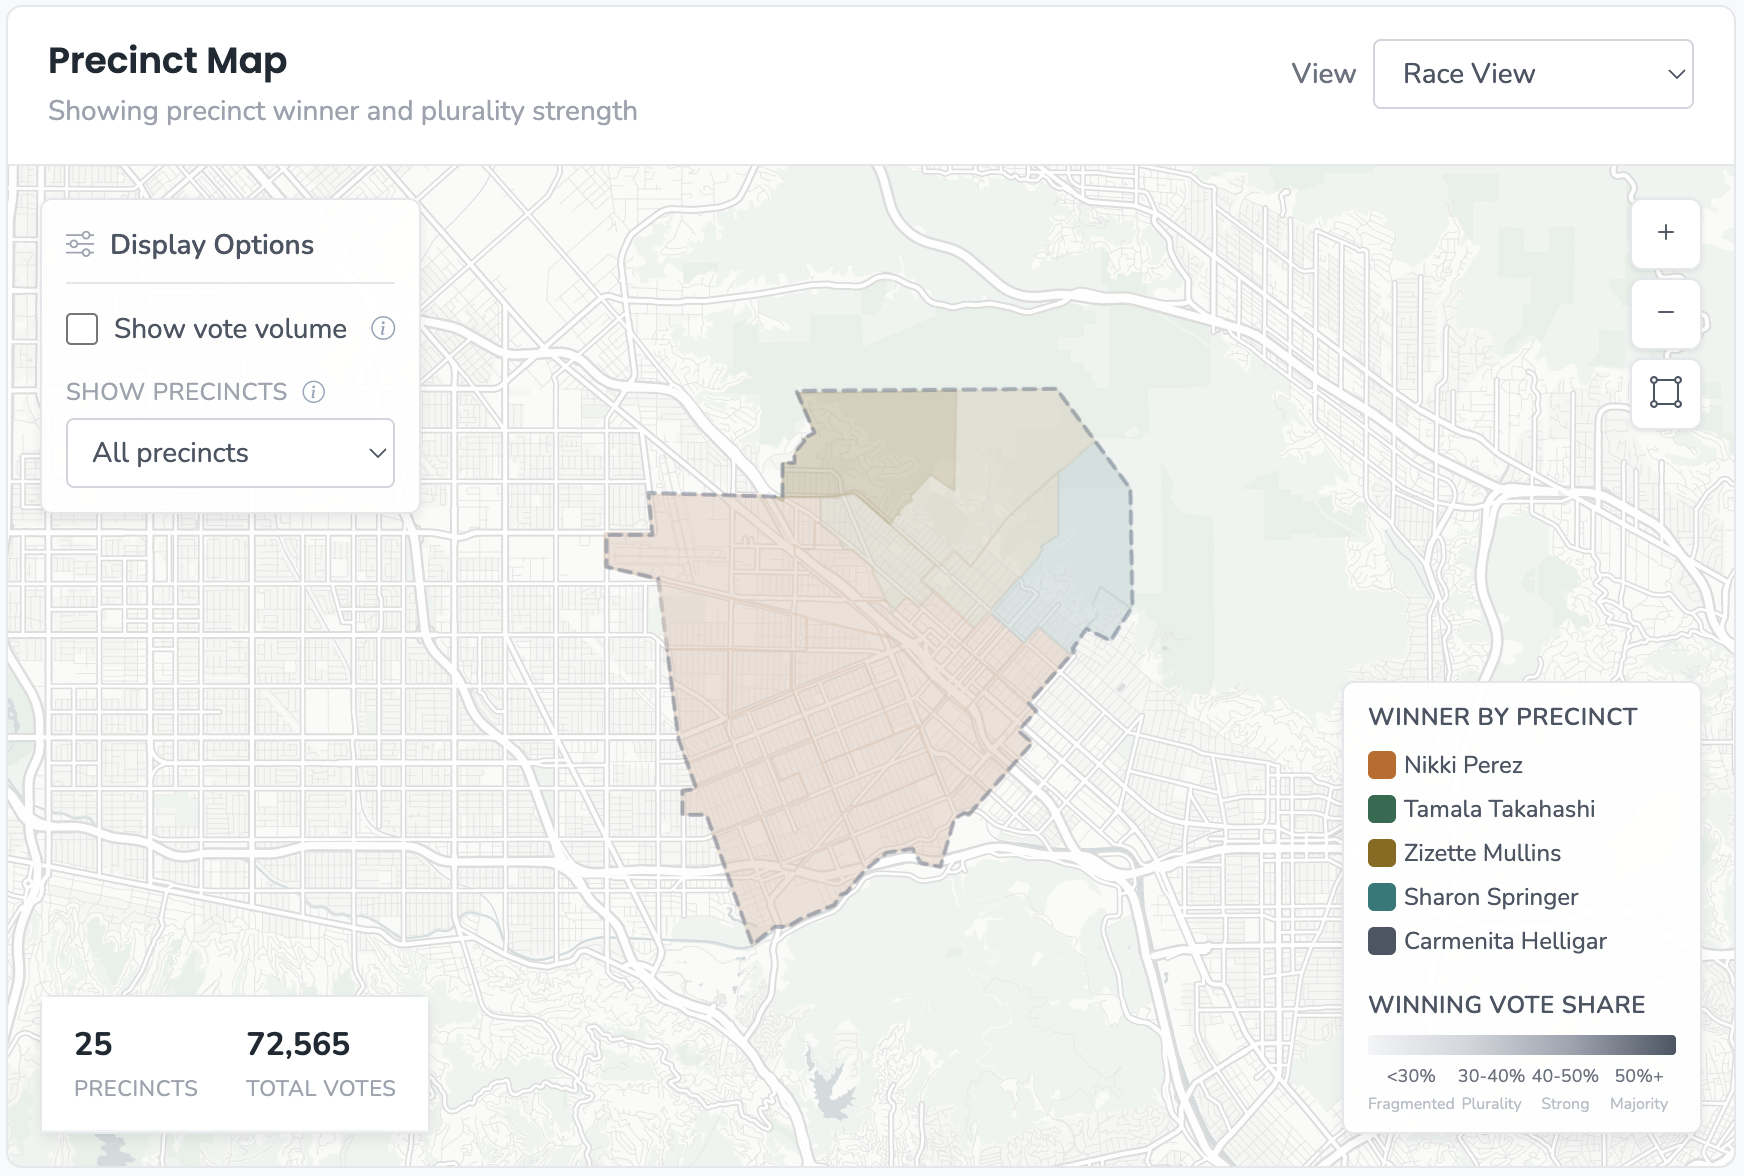
Switch between candidates and you see it immediately: Mullins's strength concentrated in the eastern and southeastern precincts—the more Republican-leaning parts of Burbank. Springer's map looked similar but paler. They were fishing in the same pond, and Mullins was catching more.
Perez's map was different: strong performance across the western and central precincts, consistent orange everywhere. She wasn't winning any precinct by huge margins, but she wasn't losing any either.
What It Actually Meant
The story that emerges isn't "the incumbent lost"—it's why she lost in a way that was structurally predictable.
In a five-way race for three seats, the Democratic-leaning vote split three ways (Perez, Takahashi, Helligar). The Republican-leaning vote split two ways (Mullins, Springer). Mullins won her split decisively—29% peak versus 24% peak. Springer lost hers.
Springer didn't lose because she was Republican-aligned in a Democratic city. Mullins was also Republican-aligned and she won. Springer lost because when two candidates compete for the same voter pool, only one survives. Mullins dominated the eastern precincts; Springer came in second in her own base.
Meanwhile, Perez won not by mobilizing progressives harder than Takahashi or Helligar, but by having no geographic or partisan weakness. She was the only candidate who didn't pay a penalty somewhere.
What You Can Actually Say
"Springer's loss wasn't random—it was structural. The party alignment data shows she and Mullins were both drawing from Republican-leaning voters, competing for the same precincts in eastern Burbank. Mullins won that competition decisively: 29% peak in Republican areas versus Springer's 24%.
In a three-seat race, the Republican-leaning vote could only support one candidate. Mullins got there first. Springer finished second in her own base, which in a D+37 city means finishing fourth overall.
The path Perez took was different—consistent 22-27% everywhere, no geographic weakness. She won not by dominating any slice of the electorate but by being acceptable to all of them. For next time: in a multi-seat race, coalition breadth beats coalition depth. The candidate who can avoid a penalty anywhere is the one who survives."
When This Isn't the Right Approach
This analysis requires precinct-level data and enough precincts to see patterns. A race with five precincts won't tell you much. Neither will a race where all candidates drew from identical coalitions—if the partisanship score is low, there's no partisan story to tell.
It's also limited to explaining voting patterns—not campaign decisions, funding choices, or earned media. The data tells you what happened at the ballot box. Why voters felt the way they did is inference from there.