The Summary page is your 60-second orientation to any California jurisdiction. Before diving into detailed analysis, start here to understand a place's basic political character: Is it Democratic or Republican? Progressive or moderate? Wealthy or working-class? This guide explains how to read the Summary page and what the key metrics mean.
Finding a Jurisdiction
There are several ways to navigate to any jurisdiction's Summary page:
- Global search (press
/anywhere): Type a jurisdiction name and click the result - Explore page: Browse jurisdictions included in your subscription
- Sidebar navigation: Expand "Districts" for legislative districts, or "Places" for counties, cities, and school districts
The Summary page is the default landing page for any jurisdiction—it's home base for all other analysis.
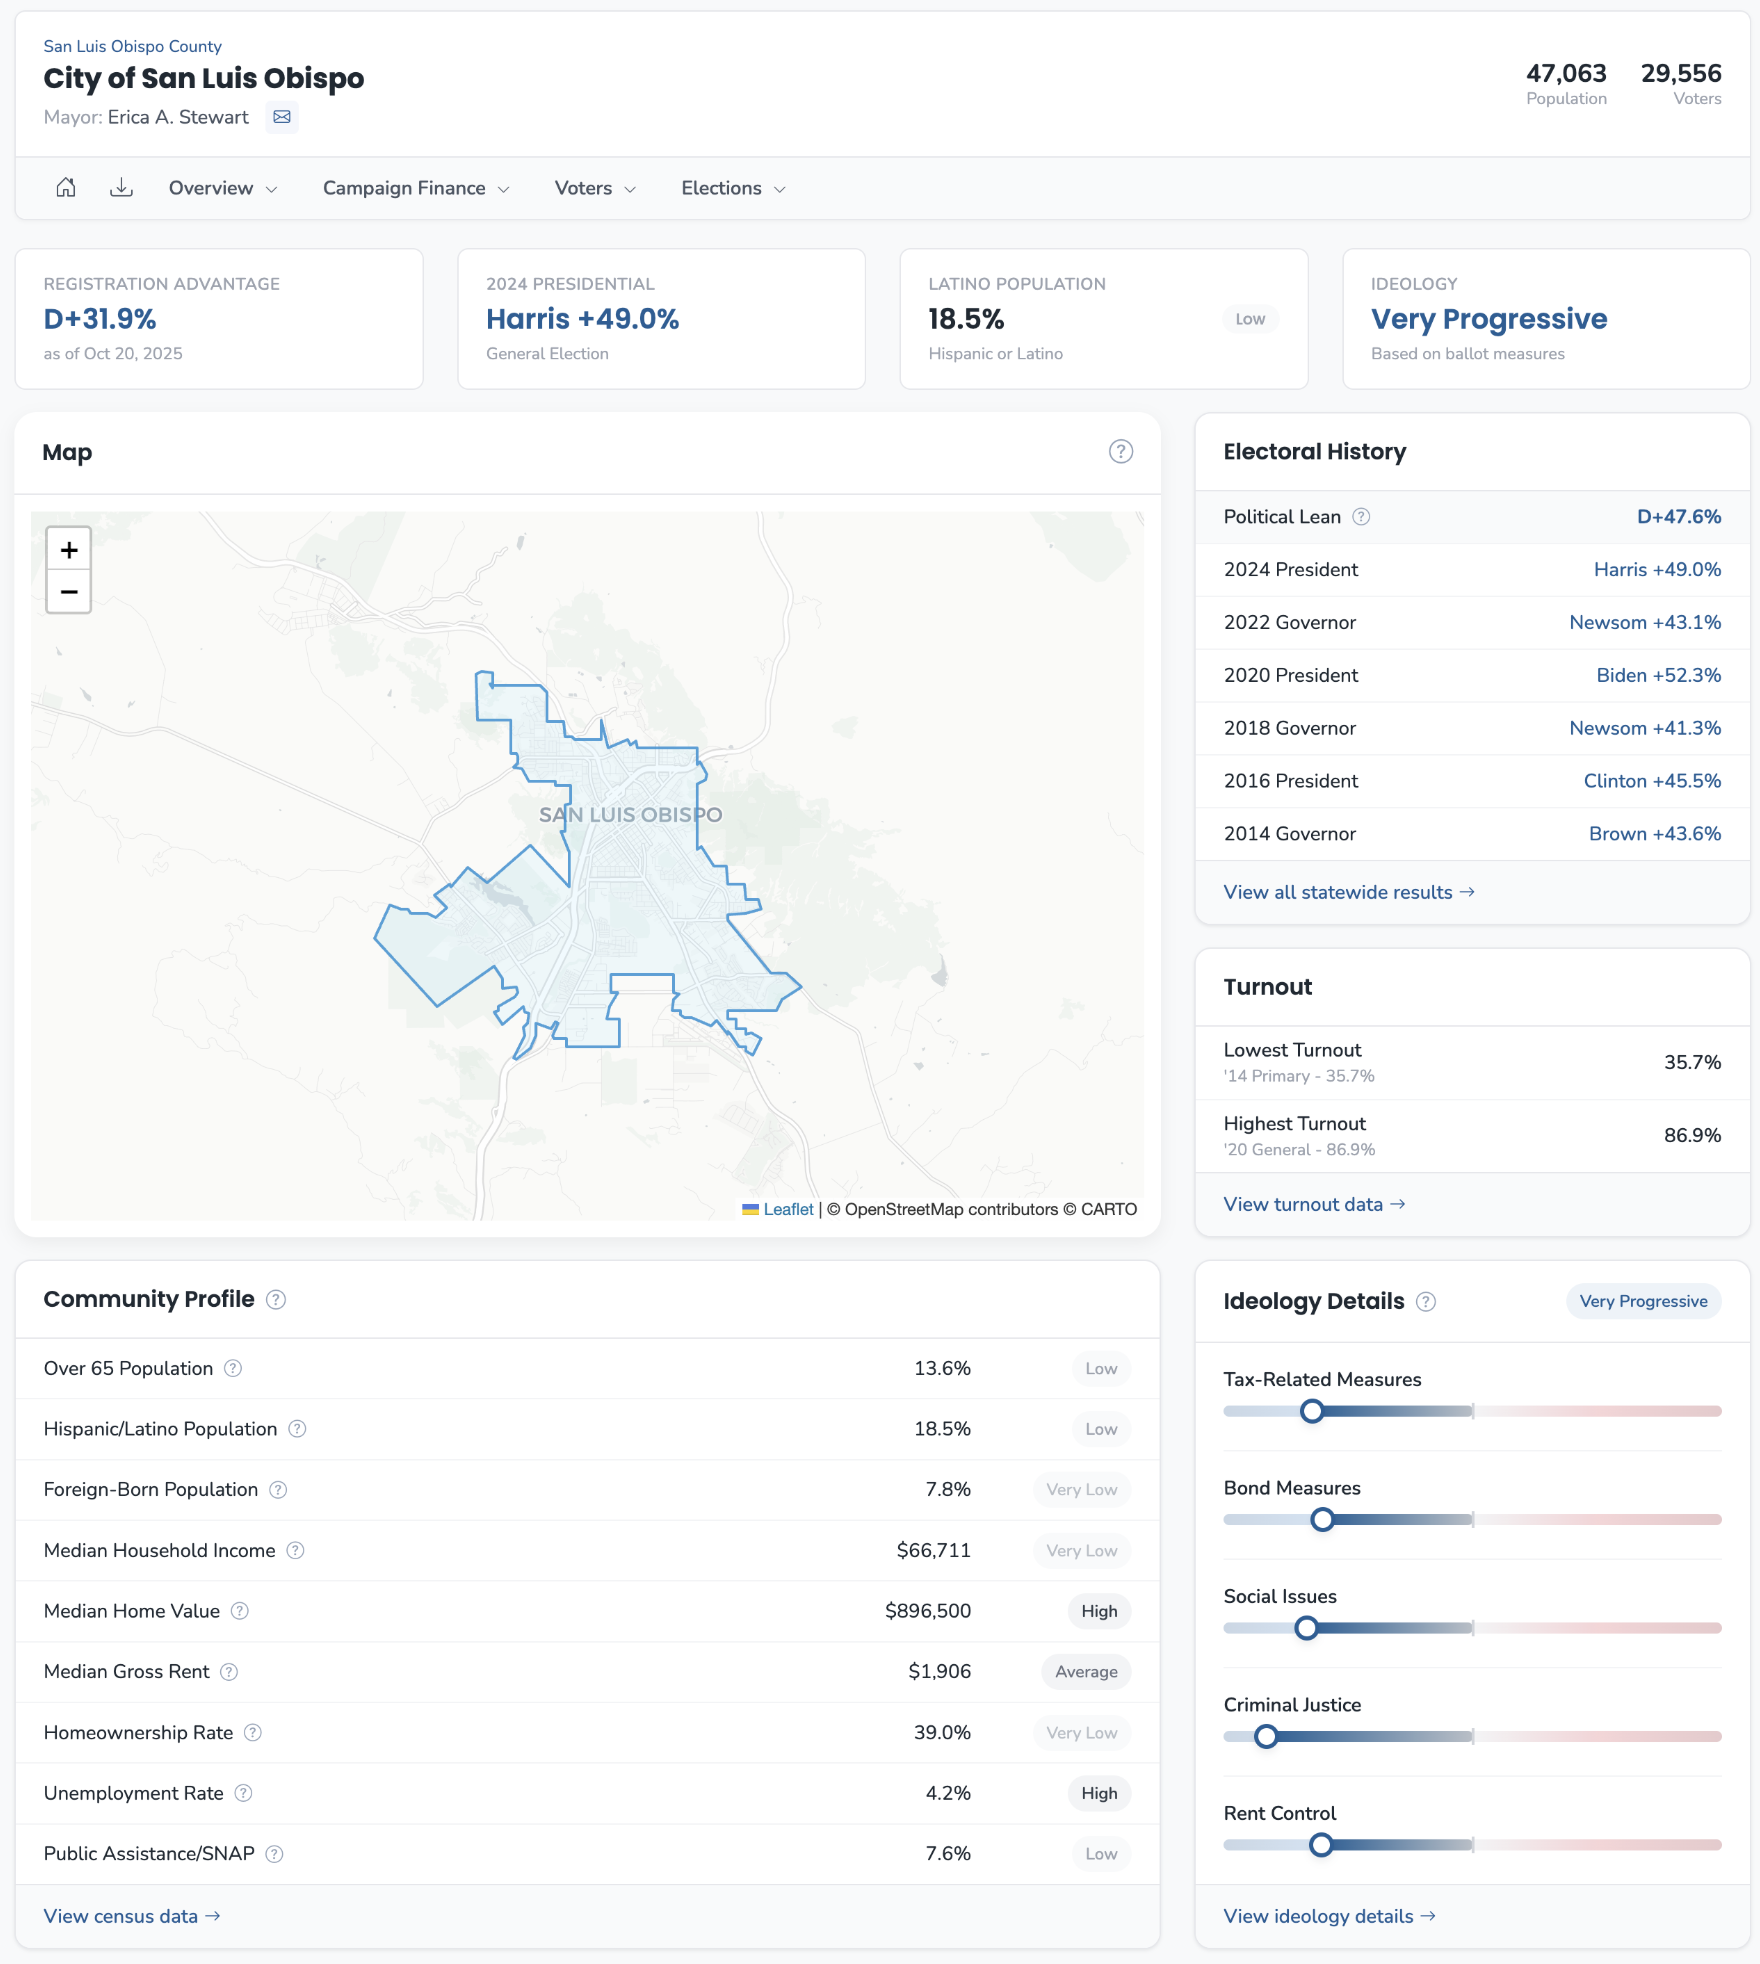
The Four Headline Metrics
At the top of every Summary page, four KPIs provide instant orientation:
Registration Advantage shows the gap between Democratic and Republican registration. "D+20.8%" means Democrats have 20.8 percentage points more registered voters than Republicans. This is raw registration, not voting behavior.
Presidential Result shows the margin in the most recent presidential race. "Harris +30.9%" means the Democratic candidate won this jurisdiction by 30.9 points. This is the clearest recent benchmark of partisan behavior.
Latino Population shows the percentage of residents who identify as Hispanic or Latino, with a relative standing badge comparing to other California jurisdictions.
Ideology classifies the jurisdiction as Progressive, Moderate, or Conservative based on how voters here voted on statewide ballot measures—not candidate races.
Understanding Registration vs. Voting
Registration Advantage and Presidential Result measure different things:
- Registration Advantage reflects who is registered—a snapshot of self-identification
- Presidential Result reflects how people actually voted
These can diverge significantly. A jurisdiction might show D+10% registration but D+25% presidential margin if Republican-registered voters frequently cross over. Conversely, low Democratic turnout could make a D+15% registration area competitive in practice.
Always check both metrics. Registration tells you the baseline; voting tells you behavior.
The Electoral History Table
Below the headline metrics, the Electoral History table shows margins across multiple statewide races:
- Political Lean: A weighted average of margins across recent races—your single summary number for how this jurisdiction votes relative to the state
- Presidential results (2024, 2020, 2016)
- Governor results (2022, 2018, 2014)
Look for consistency or divergence. A jurisdiction that was Harris+15 but Newsom+25 behaves differently in gubernatorial versus presidential contexts.
Community Profile
The Community Profile section displays Census-derived demographic and economic indicators:
- Over 65 Population
- Hispanic/Latino Population
- Foreign-Born Population
- Median Household Income
- Median Home Value
- Median Gross Rent
- Homeownership Rate
- Unemployment Rate
- Public Assistance/SNAP Recipients
Each metric includes a relative standing badge (Very Low, Low, Average, High, Very High) comparing to other California jurisdictions of the same type. A "High" median income for a city means it's in the upper tier among California cities.
Scan for standout badges. Any "Very High" or "Very Low" indicates a defining characteristic worth noting.
Ideology Details
The Ideology section breaks down ballot measure voting by category:
- Tax-Related Measures
- Bond Measures
- Social Issues
- Criminal Justice
- Rent Control
Each category shows a spectrum bar indicating where this jurisdiction falls between conservative and progressive positions. A jurisdiction can be "Progressive" overall but "Moderate" on criminal justice—these category breakdowns reveal that nuance.
Click "Details" on any category to see the individual propositions that contributed to the score.
Registration by District
For jurisdictions with sub-districts (city council districts, supervisor districts, trustee areas), a comparison chart at the bottom shows registration percentages across all districts. This quickly identifies which districts are most and least competitive.
Common Mistakes
Confusing registration with voting. D+15% registration does not mean a Democrat wins by 15 points. Turnout, independents, and crossover voting change outcomes.
Over-indexing on presidential results. Presidential margins reflect the most nationalized election. Local races in the same jurisdiction may behave very differently.
Mixing relative and absolute context. The standing badges compare to other California jurisdictions. When absolute values matter—like understanding actual housing costs—check the raw numbers alongside the badges.
Assuming ideology is monolithic. A "Progressive" overall rating can mask "Conservative" positions on specific issues. Check the category breakdowns.
The Summary page is your starting point, not your endpoint. Use it to orient yourself quickly, then drill into the detailed pages—Voter Metrics, Census Data, Ideology Analysis—when you need deeper understanding.