Demographic data explains the constraints within which politics operates. It does not predict outcomes—but it defines what is possible, what is resonant, and what is risky.
A jurisdiction's age distribution, income levels, housing patterns, and educational attainment shape which policies matter to residents, which messages will land, and where outreach is likely to succeed or fail. Demographics are context, not destiny—but ignoring them leads to tone-deaf campaigns and misallocated resources.
What Demographic Data Tells You (and Doesn't)
Demographics answer questions about who lives somewhere, not how they vote:
- What kinds of people live here? Age, ethnicity, citizenship, household structure
- What economic pressures dominate daily life? Income levels, rent burden, unemployment, public assistance
- Which policy issues are likely salient? Housing costs matter where rent burden is high; healthcare matters where uninsured rates are elevated
- Where might messaging or outreach fail if misaligned? Language access needs, educational composition, economic assumptions
Demographics do not tell you:
- How people will vote
- Why they hold the views they hold
- Whether specific voters will turn out
- How subgroups within a jurisdiction differ from each other
This data establishes the landscape. Voting behavior comes from Voter Metrics and Ideology Analysis.
Key Interpretive Concepts
Residents versus voters. Census data covers all residents—including non-citizens, those under 18, and people who never vote. The actual electorate differs in composition.
Sample-based estimates. Most detailed Census metrics come from the American Community Survey (ACS), which surveys a sample of households over five years. For small jurisdictions (under 20,000 population), margins of error can be substantial. Don't over-interpret small differences.
Point-in-time snapshots. Population counts are from the 2020 Census; socioeconomic data represents 2019-2023 averages. Fast-changing areas may look different today.
Relative standings. The platform shows where a jurisdiction ranks compared to peers (Very Low through Very High). This makes comparison across jurisdictions fast and meaningful—you can immediately see which places are outliers on any metric.
Finding Census Data
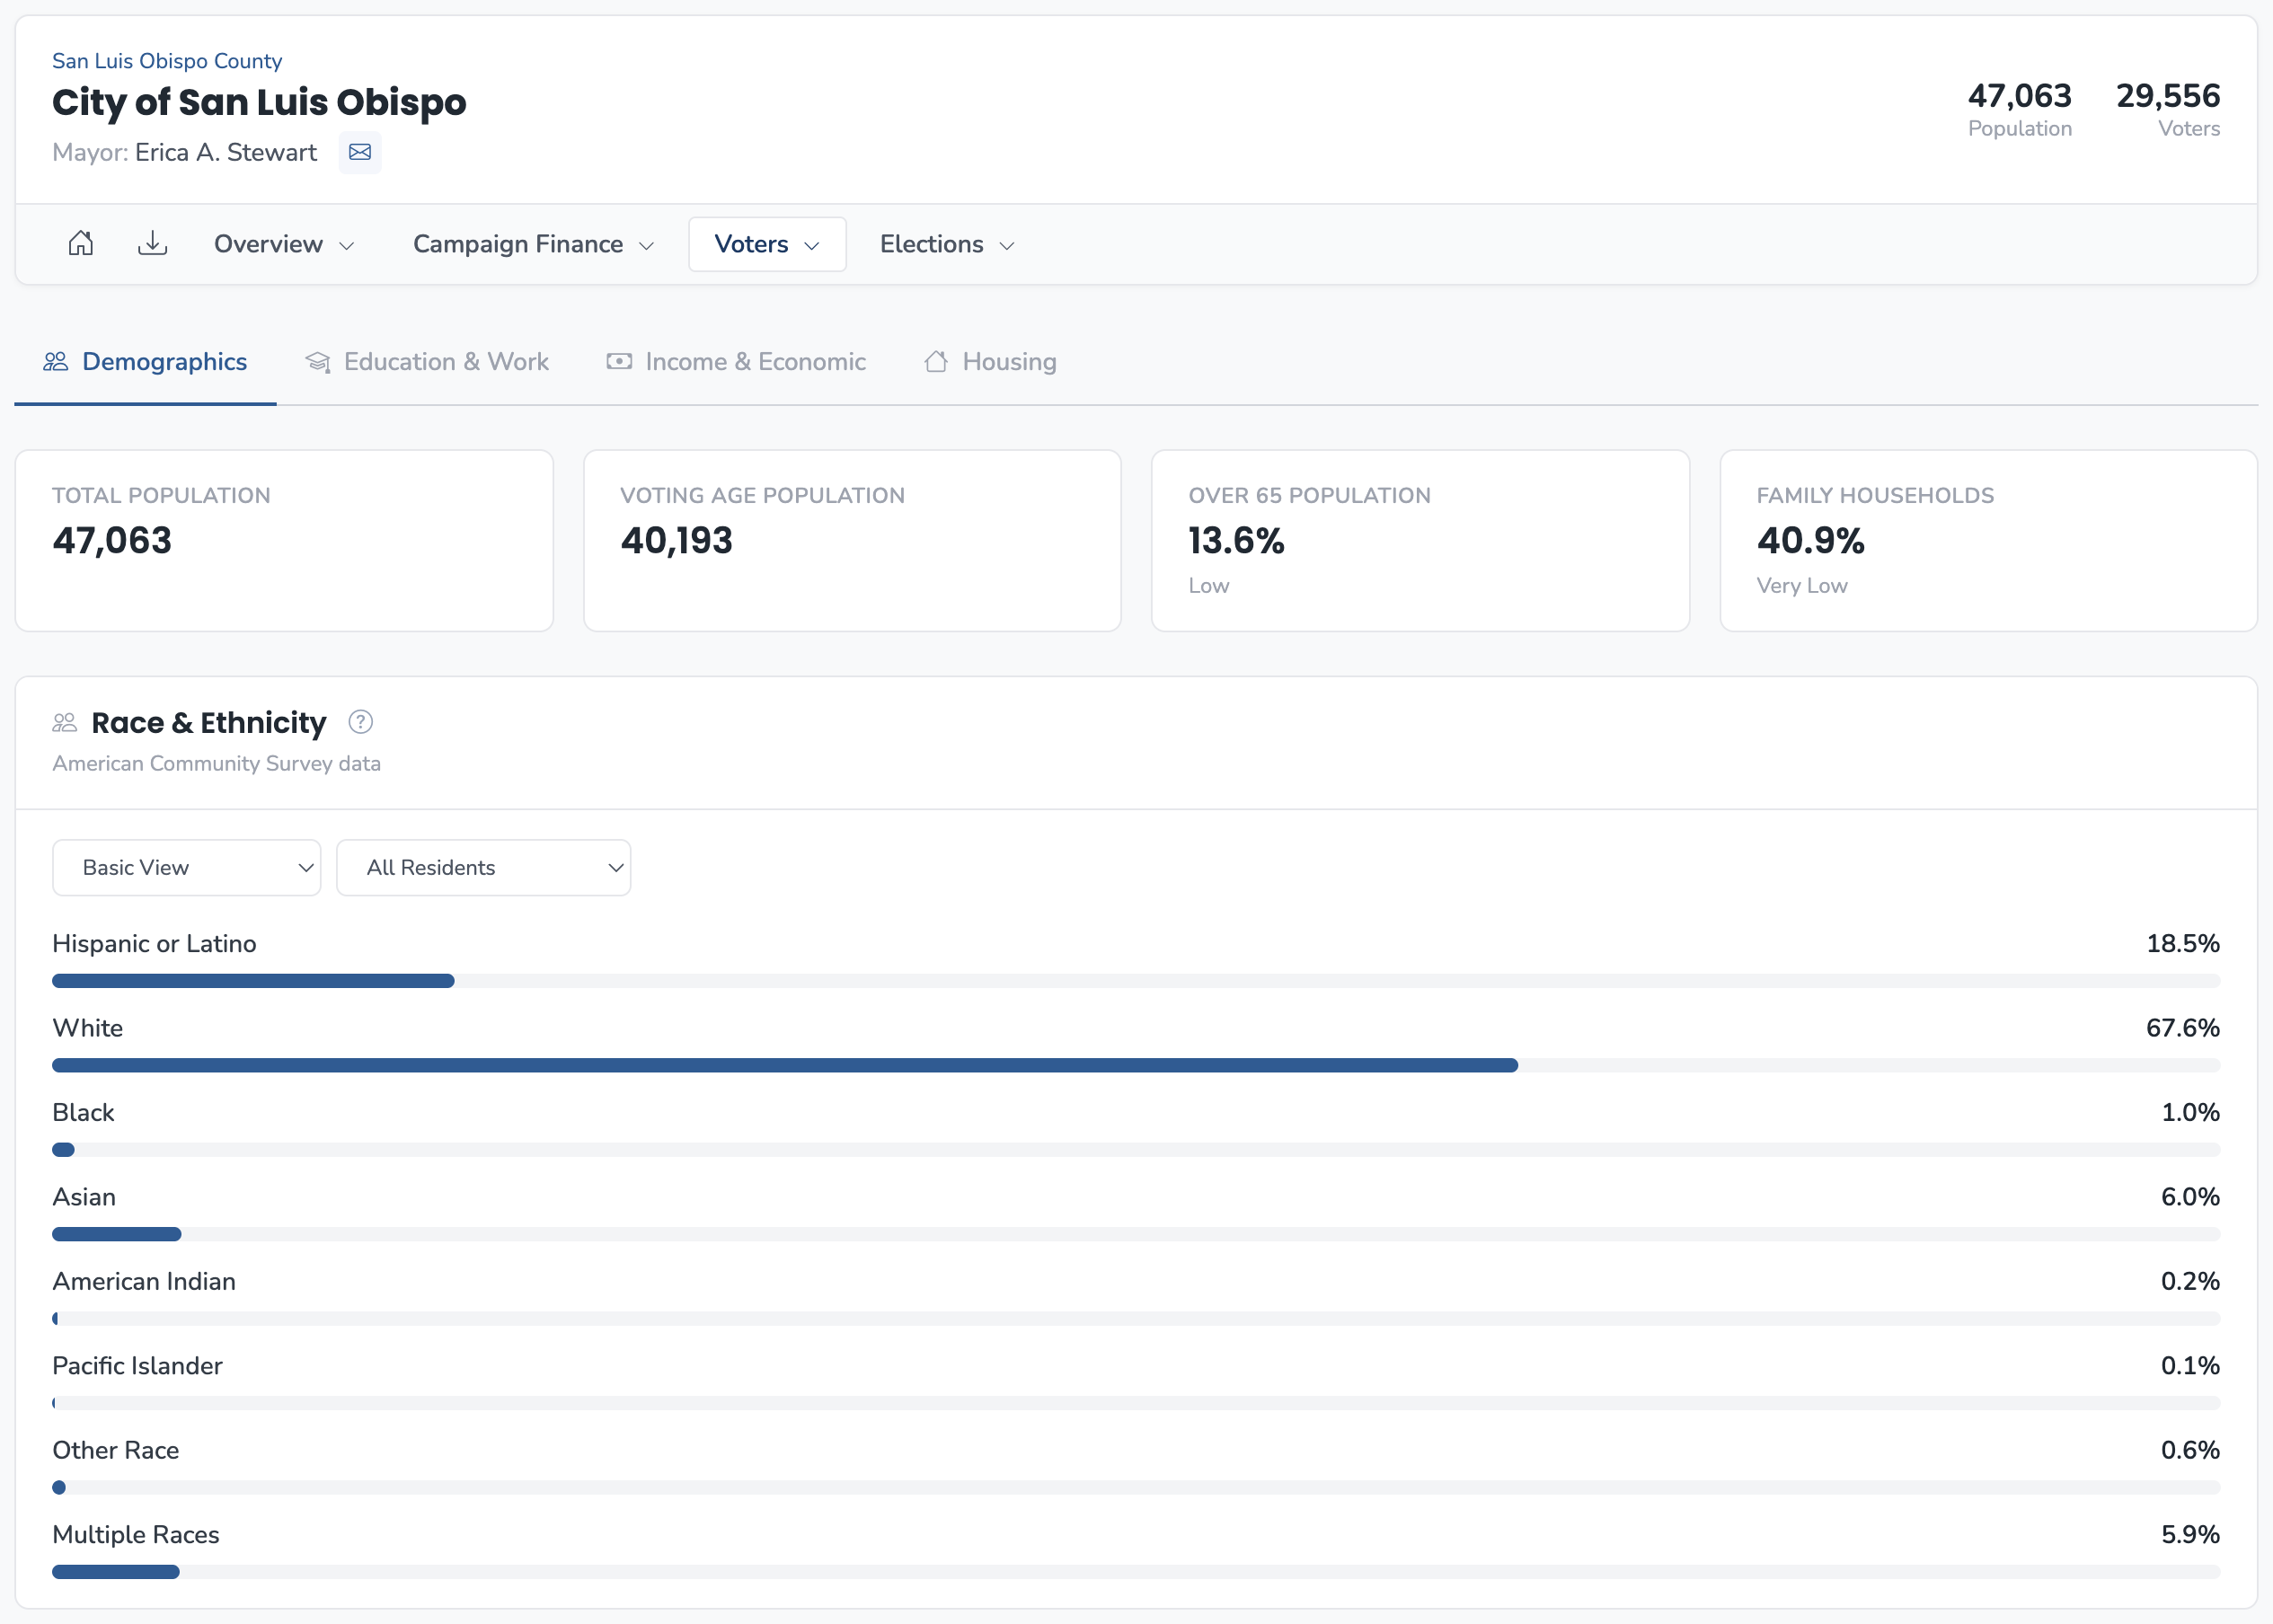
On any jurisdiction page, click the Voters tab, then select Census Data. From there you can access four views: Demographics, Education & Work, Income & Economic, or Housing.
You can also reach Census Data from the Summary page, where the Community Profile section links to the detailed views.
How Demographic Data Is Organized
The four tabs divide Census data by theme:
Demographics covers population composition: race/ethnicity (with both standard and Voting Rights views), age distribution, household structure, language spoken at home (including Limited English rates), school enrollment, and citizenship status.
Education & Work covers educational attainment, labor force participation, industry of employment, and commuting patterns.
Income & Economic covers household income distribution, public assistance and SNAP usage, earner counts, and health insurance coverage.
Housing covers housing stock age, unit types, rent distribution, rent burden (critically important), and home values.
Each tab displays four headline metrics with standing badges, followed by detailed breakdowns.
Analytical Patterns Worth Knowing
Economic stress signals. High rent burden (30%+ of income on housing), elevated public assistance rates, and above-average unemployment together indicate economically vulnerable constituencies. Cost-of-living and economic security messaging will resonate.
Working-class profiles. High school completion without bachelor's degrees, manufacturing/retail/construction industry concentration, middle-income clustering—these patterns suggest communities where labor, wages, and job security matter.
Language access requirements. Check Language Spoken at Home for groups above 5% of population, then check Limited English rates within each group. This directly informs translation and accessibility decisions.
Age-driven concerns. Senior-heavy jurisdictions (high 65+ population, high homeownership, high "no earners" households) respond to Medicare, Social Security, and property tax messaging. Young professional areas (elevated 25-34 age brackets, high renters, high bachelor's rates) respond to housing affordability and urban amenity messaging.
Affluence indicators. High median income, low public assistance, high homeownership, high educational attainment, and high home values together mark affluent areas—relevant for donor prospecting and policy positioning.
These patterns are context for political judgment—not mechanical targeting rules. Use them to ask better questions, not to skip the work of understanding a place.